An objective is a way of describing a future state from the perspective of the present state. It is where you want to arrive at from where you currently are. Most organisations will have considered sustainability objectives as part of their business strategy and, as with any other strategic objective, begun to consider what resources are required to achieve them. Generally, when agreeing on operational objectives derived from the business strategy, they should be Specific, Measurable, Achievable, Realistic, and Timebound… S.M.A.R.T.
Sustainability, as we are coming to understand it, includes climate action being measured globally against two objectives: to have 50% fewer carbon emissions by 2030 and to achieve net-zero carbon emissions by 2050. These objectives were agreed through the UN at successive COP meetings and had global buy-in at the time. Of late, there has been some weakening of determination and unanimity, largely driven by leadership changes as well as the practical realisation of just how difficult it will be to keep some of those promises.
Greenhouse gas (GHG) emissions are measured using standards such as those established by the GHG Protocol. Emissions are classified in three scopes: Scope 1 refers to direct emissions, Scope 2 are indirect emissions from purchased energy, and Scope 3 refers to all other indirect emissions in the value chain. Many organisations are already tracking these, and many projects are ongoing that are making progress on the global goal.
In the bid to achieve the carbon emissions objectives, a few of the biggest assumptions are:
- That much of the transport, heating, air-conditioning, and electricity generation emissions could be converted to electric alternatives,
- That electrical energy sources can be exclusively renewable, and / or
- That the degree of captured carbon can be increased at a pace that matches the objective.
Some sectors, within which there is universal agreement, have set out ambitious plans. Take the Aviation sector as a great example. It has clearly outlined how technical achievements such as better engines, lighter manufacturing materials, and sustainable aviation fuel, etc. could make the ‘net zero by 2050’ objective possible.[1] But, going back to S.M.A.R.T. objectives, I’d like to focus on the ‘M’ for Measure because monitoring key metrics keeps us focused on the task. However…
Measuring climate metrics has a good and a bad side. When you view the chart of the world’s greenhouse gas emissions, it doesn’t look like good news:
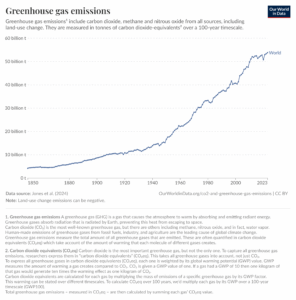
(Source: https://ourworldindata.org/greenhouse-gas-emissions)
Here’s another bad-side headline:
It’s official: 2024 was the planet’s warmest year on record, according to an analysis by scientists from NOAA’s National Centres for Environmental Information (NCEI).[2]
Some more bad news, especially if you live near the coast:
Global sea level rose faster than expected in 2024, mostly because of ocean water expanding as it warms, or thermal expansion. According to a NASA-led analysis, last year’s rate of rise was 0.23 inches (0.59 centimetres) per year, compared to the expected rate of 0.17 inches (0.43 centimetres) per year.[3]
And one last piece of bad news:
BP has announced it will cut its renewable energy investments and instead focus on increasing oil and gas production.[4]
Remember, though, to measure the good side as well. All too often we don’t hear about the good things that mark our collective progress towards the achievement of the climate objectives. And, honestly, I get a bit depressed when I read the bad headlines. But take a closer look and you’ll find that there are a lot of good things going on. Here are a few positive metrics, maybe even enough to cheer you up…
By the end of 2024 there were almost 58 million electric vehicles in use. Of these, almost 14 million were added to the global fleet in 2023 and over 17 million in 2024.[5]
Around 25 million households have solar panels around the world, according to the IEA. These installations generate a peak output of 130GW – which is 12.3% of the total global capacity. There will be 100 million homes with solar panels by 2030, the IEA has forecasted.[6]
In 2023, there were believed to be in the region of 400,000 wind turbines globally, generating approximately 840 gigawatts of power.[7]
It’s not all grim; there is a lot of good offsetting the bad. Now, bearing that in mind, how does the carbon emissions chart look? Less ominous?
When it comes to the ‘M’ in your carbon emission objectives, make sure you’re accounting for the positive side as well as the negative one. The optimist in me is confident that the global carbon emissions objectives are still achievable – that’s why CalQRisk has acquired a carbon accounting software application. It’s called GreenFeet and it has helped many organisations to measure, mitigate and report on their carbon consumption. With minimal effort from your organisation, GreenFeet will track and measure your Scopes 1, 2 and 3 carbon consumption and, by extension, show you how you are progressing towards and how you can improve upon the achievement of your carbon emission reduction objectives. You do have some, right?
[1] (2025) ‘Our Commitment to Fly Net Zero by 2050’, IATA, available: https://www.iata.org/en/programs/sustainability/flynetzero/ [accessed 15 May 2025].
[2] (2025) ‘2024 was the world’s warmest year on record’, National Oceanic and Atmospheric Administration, available: https://www.noaa.gov/news/2024-was-worlds-warmest-year-on-record#:~:text=It’s%20official%3A%202024%20was%20the,extent%20(coverage)%20on%20record. [accessed 15 May 2025].
[3] Lee, J. (2025) ‘NASA Analysis Shows Unexpected Amount of Sea Level Rise in 2024’, NASA, available: https://sealevel.nasa.gov/news/282/nasa-analysis-shows-unexpected-amount-of-sea-level-rise-in-2024/#:~:text=Global%20sea%20level%20rose%20faster,(0.43%20centimeters)%20per%20year. [accessed 15 May 2025].
[4] Jack, S. and Masud, F. (2025) ‘ BP shuns renewables in return to oil and gas’, BBC, available: http://Website URL [accessed 15 May 2025].
[5] (2025) ‘Trends in electric car markets’, IEA Global EV Outlook 2025, available: https://www.iea.org/reports/global-ev-outlook-2025/trends-in-electric-car-markets-2 [accessed 15 May 2025].
[6] The International Energy Agency (2022) ‘Approximately 100 million households rely on rooftop solar PV by 2030′, IEA Reports, available https://www.iea.org/reports/approximately-100-million-households-rely-on-rooftop-solar-pv-by-2030 [accessed 15 May 2025].
[7] (2023) ‘The Largest Wind Farm in the World’, Discovery, available: https://www.discoveryuk.com/building-big/the-largest-wind-farm-in-the-world/#:~:text=Thereby%20creating%20the%20world’s%20first,the%20region%20of%20840%20GW. [accessed 15 May 2025].
Recent News

Corporate Sustainability Reporting Directive – are we there yet?
CalQRisk Shortlisted – Compliance & RegTech Award | FS Awards 2025 Dublin

CalQRisk Shortlisted at the CIR Risk Management Awards 2025!

Credit Union Risk Advisory Service Freebies
Credit Union Risk Advisory Service Achievements So Far in 2025

How to Respond to a Data Breach – A DPO Guide

Carbon Accounting – I’ve calculated my emissions – How do I report?

Carbon Accounting – I have my data, what’s next?

Carbon Accounting – Where Do I Start ?
